# TradeInsight: Trade Journal Platform with Instant Analytics
[TradeInsight](https://tradeinsight.jainabhinandan.com) is a trade journal platform to log trades, analyze performance, and spot behavioral patterns. Upload your broker CSV and get instant analytics, P&L metrics, and insights—all client-side, no backend required.
## Why a Client-Side Trade Journal?
Your brokerage data stays on your machine. No server uploads, no accounts—just open the app, drop a CSV, and see your equity curve, win rate, and behavioral tags. TradeInsight supports Zerodha, Groww, Angel One, and Kotak transaction statements with auto-detection of column format.
## Features
### CSV Import
- Upload broker statements (Zerodha, Groww, Angel One, Kotak Transaction Statement).
- Auto-detects format via column mapping.
- CSV Format Help in the app lists all supported column names and aliases so you can align your export if needed.
### Trade Matching
- Pairs buy/sell orders into round-trip trades using FIFO logic and partial fills.
- Each trade has entry/exit, duration, and R-multiple (risk multiple) for consistent performance view.
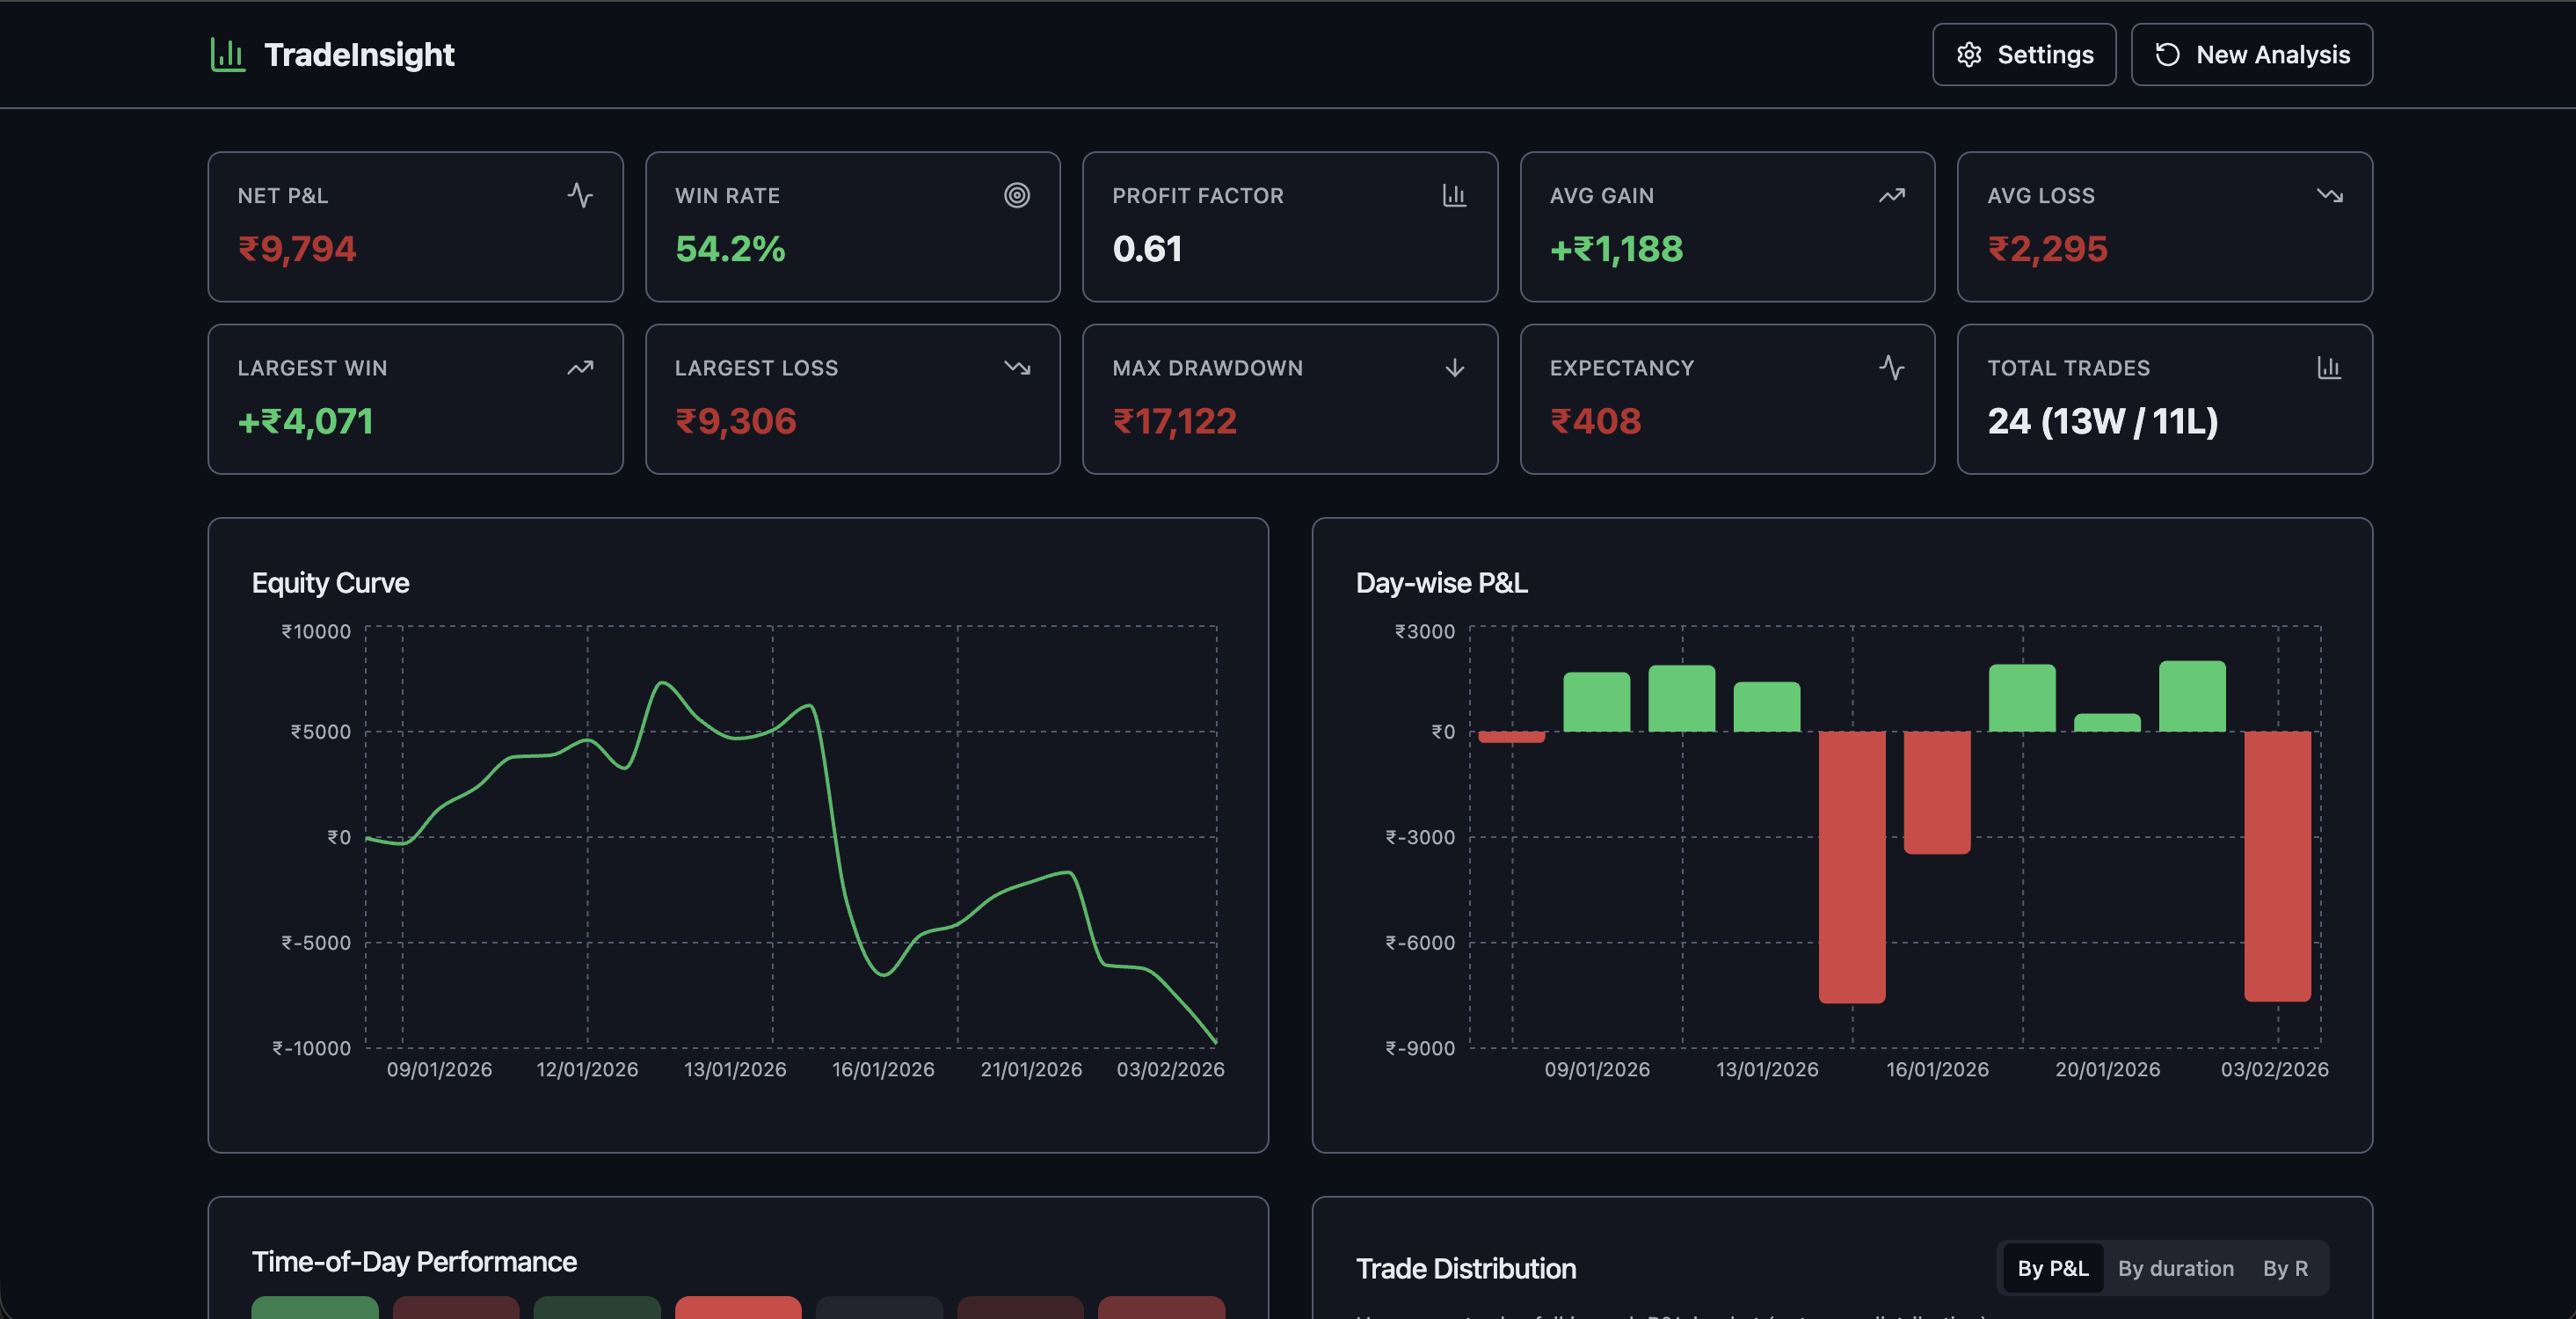
### Analytics
- Net P&L, win rate, profit factor, expectancy, max drawdown.
- Equity curve — cumulative P&L over time.
- Day-wise P&L — bar chart of daily performance.
- Time-of-day heatmap — when you trade best or worst.
### Trade Distribution
- Switchable views:
- By P&L — bucket trades by profit/loss ranges.
- By duration — e.g. 0–5m, 5–15m, 15m+.
- By R-multiple — e.g. <-2R, 0–1R, 2R+.
### Behavioral Insights
- Detected patterns with impact: Revenge Trading, Overtrading, Late Exit, Size Escalation.
- Tags on trades: Revenge Trade, Quick Scalp, Disciplined, etc., so you can filter and reflect on behavior.
### Trade Log
- Filterable, sortable table: symbol, side, qty, entry/exit, net P&L, duration, R-multiple, tags.
- Drill into any trade and see how it contributed to metrics and patterns.
## Getting Started
Requirements: Node.js and npm (or Bun).
``bash`
# Install dependencies
npm i
# Start the development server
npm run dev
Open the app, upload a broker CSV, and use Settings to set default risk % and max trades/day if needed.

## Tech Stack

- Vite · TypeScript · React
- shadcn-ui · Tailwind CSS
- Recharts (charts) · React Query · React Hook Form · Zod · PapaParse (CSV)

## Project Structure (High Level)

- Parsing —: broker column mapping, date/time handling (including Kotak Trade Date + Trade Time).src/lib/tradeMatching.ts
- Matching —: FIFO buy/sell pairing, partial fills.src/lib/metrics.ts
- Metrics —: P&L, equity curve, day-wise, hourly, trade distribution by P&L/duration/R.src/lib/behaviorDetection.ts`: revenge, overtrading, late exit, size escalation, tagging.
- Behavior —
---
Try it: [tradeinsight.jainabhinandan.com](https://tradeinsight.jainabhinandan.com)
More projects: [jainabhinandan.com](https://jainabhinandan.com) | [Contact](https://jainabhinandan.com/contact)