# DSA Visualizer: Visualize, Learn & Practice Algorithms
[DSA Visualizer](https://dsavisualizer.jainabhinandan.com) is an interactive web app to visualize, learn, and practice Data Structures and Algorithms. Instead of only reading pseudocode or complexity on paper, you see the algorithm run step by step—with bars, colors, and controls—while the corresponding pseudocode and time/space complexity are shown alongside.
## Why Visualize Algorithms?
Algorithms are easier to internalize when you see them. A bar chart that highlights two elements being compared, then swaps them, makes Bubble Sort click. Watching a path snake through a grid makes Dijkstra or A more intuitive. The visualizer is built for that: visual presentation, pseudocode steps, and complexity info in one place.
## What’s Included
### Algorithm Categories
The app is organized into tabs:
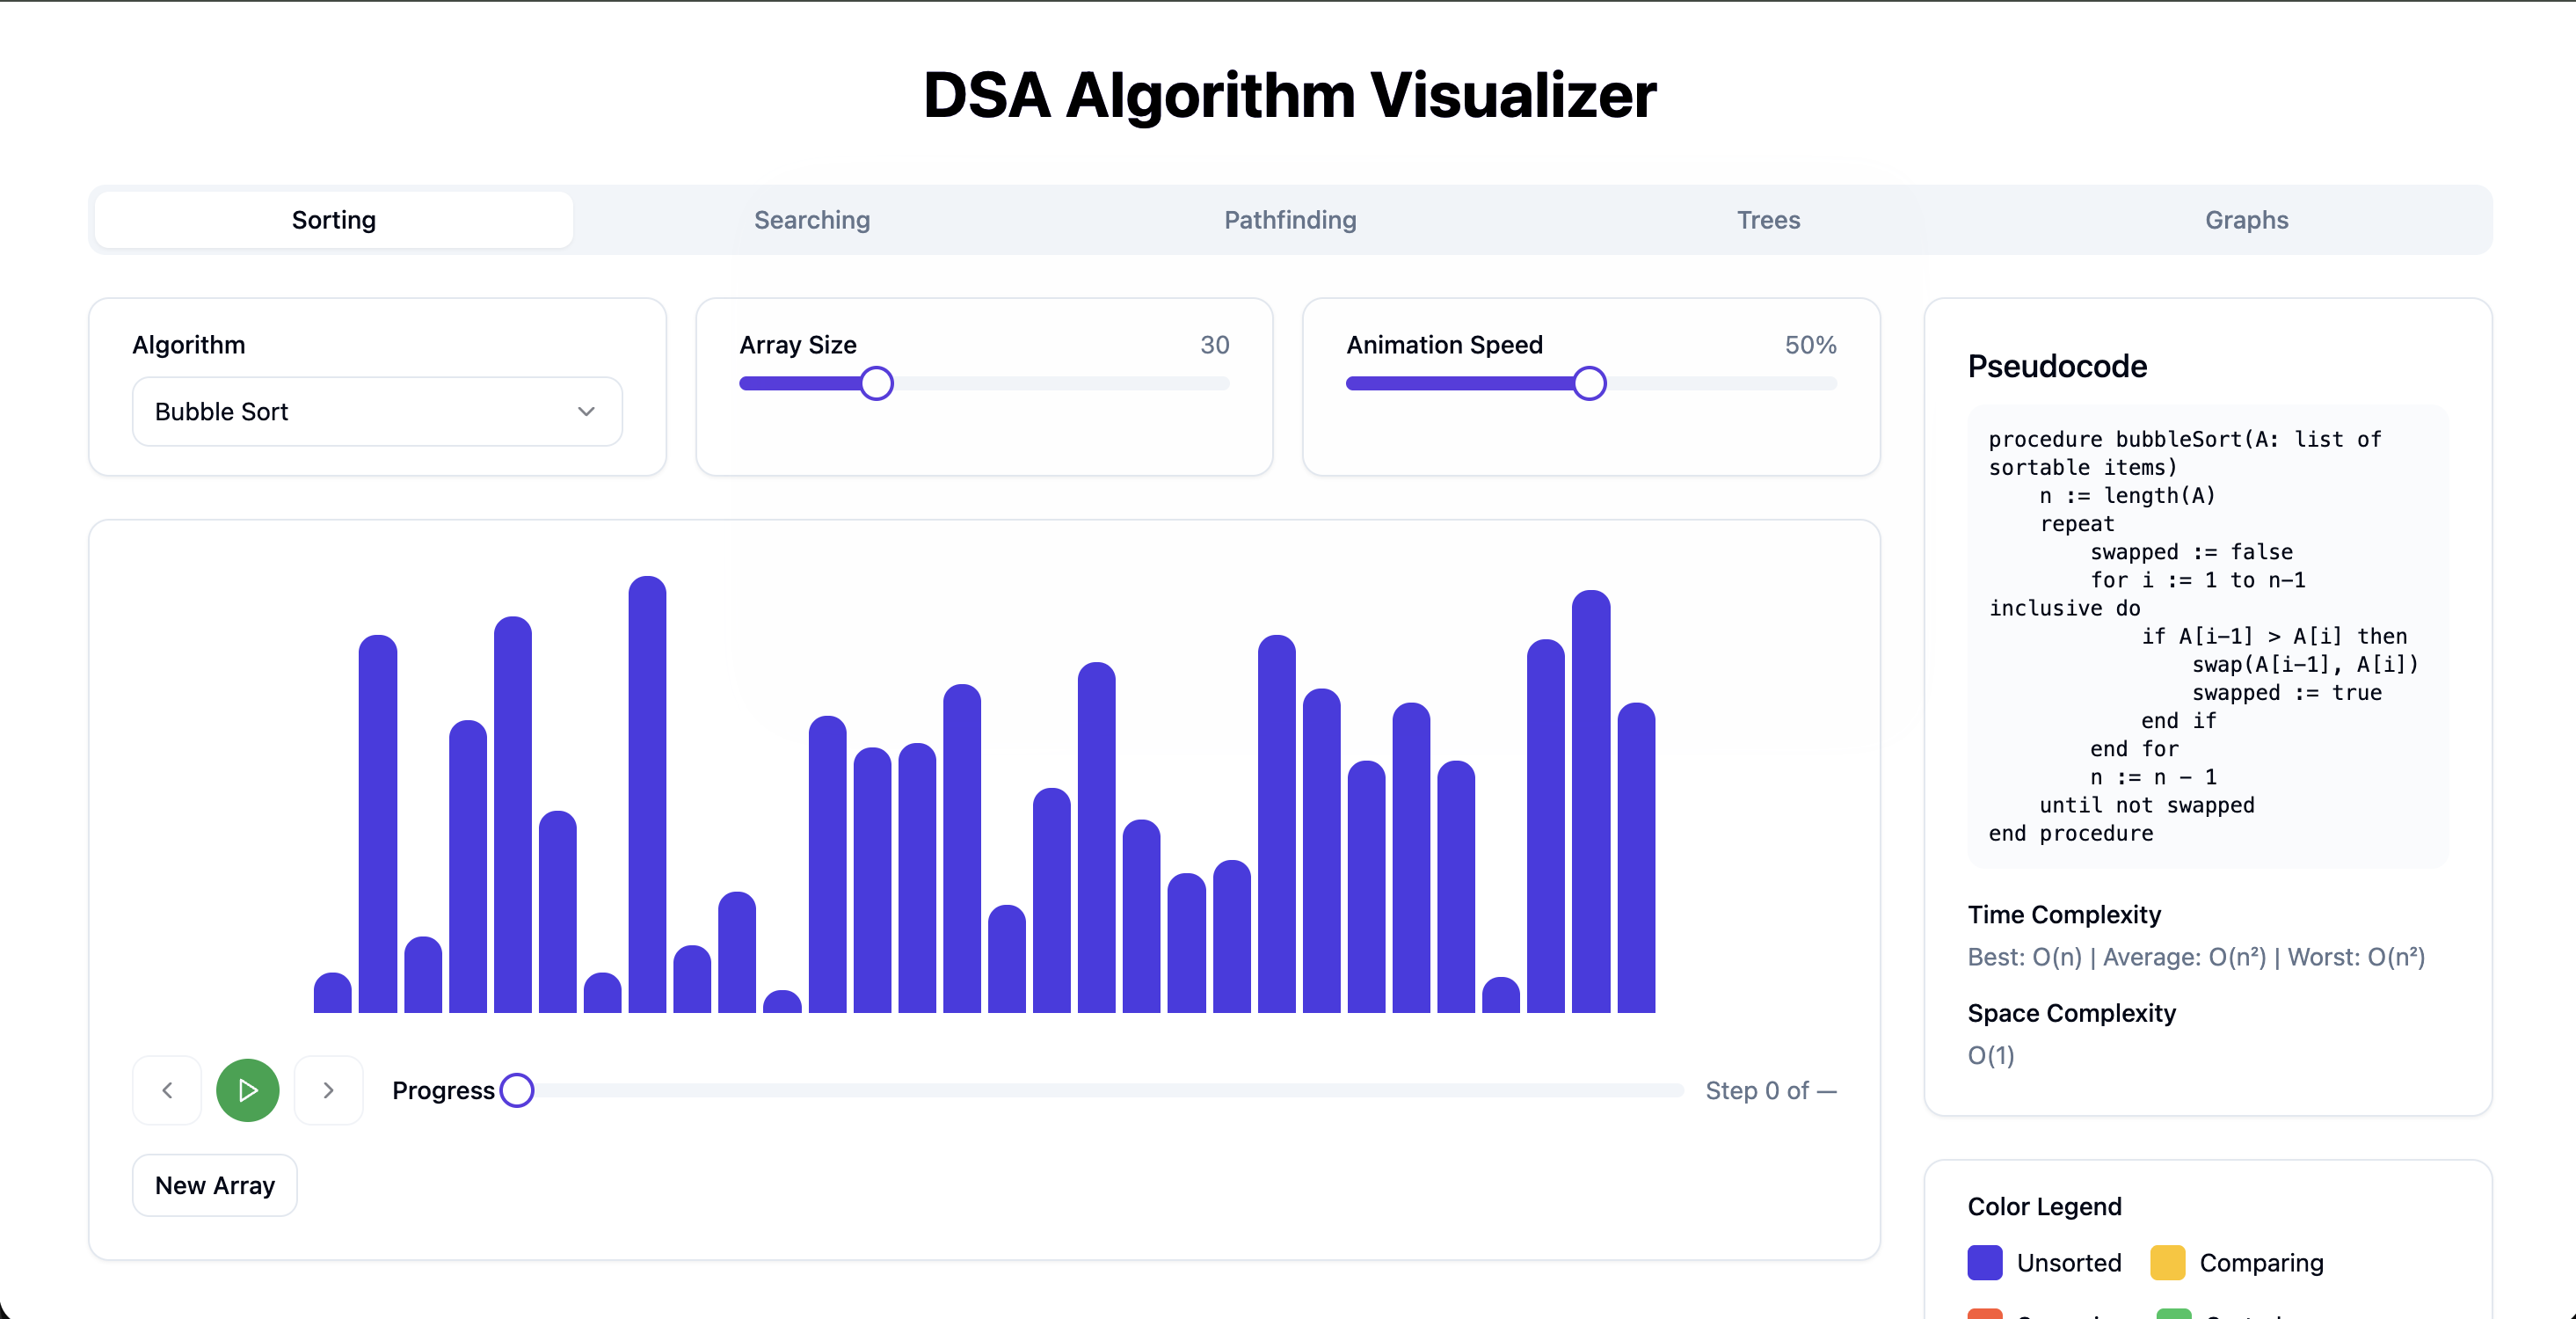
- Sorting – Bubble Sort, Merge Sort, Quick Sort, and more. Bar chart with array size and animation speed controls.
- Searching – Linear search, Binary search, etc., with clear “current element” and “target” highlighting.
- Pathfinding – Grid-based algorithms (e.g. Dijkstra, A
- Trees – Tree traversals (in-order, pre-order, post-order) and structure visualization.
- Graphs – Graph algorithms with node/edge visualization.
You pick an algorithm, adjust parameters (e.g. array size, speed), and run or step through the execution.
### Controls & UX
- Algorithm dropdown – Choose the algorithm inside the current category.
- Array size / speed – Sliders to change problem size and animation speed (e.g. 30 elements, 50% speed).
- Playback – Play, pause, previous step, next step, and a progress bar (e.g. “Step 0 of …”).
- New Array – Generate a new random array (for sorting/searching) so you can rerun without refreshing.
The central area is the visualization (e.g. bars for sorting); the right panel shows pseudocode, time complexity (best / average / worst), space complexity, and a color legend (e.g. Unsorted, Comparing, Swapped, Sorted).
### Pseudocode & Complexity
Each algorithm has:
- Pseudocode – The logical steps in plain, readable form. As the visualization advances, you can follow which step is being executed.
- Time complexity – e.g. “Best: O(n) | Average: O(n²) | Worst: O(n²)” for Bubble Sort.
- Space complexity – e.g. O(1) for in-place sorting.
This ties the “what you see” (animation) to the “what the book says” (pseudocode and complexity), which helps with interviews and deeper understanding.
### Color Legend
Colors map meaning to what’s on screen:
- Unsorted (e.g. blue) – Not yet processed.
- Comparing (e.g. yellow) – Elements currently being compared.
- Swapped (e.g. red) – Just swapped (in sorting).
- Sorted (e.g. green) – In final position.
Same idea extends to pathfinding (visited, path, wall) and other categories so the legend stays consistent and readable.
## How to Use It
1. Open [DSA Visualizer](https://dsavisualizer.jainabhinandan.com).
2. Choose a category (Sorting, Searching, Pathfinding, Trees, Graphs).
3. Select an algorithm and set array size / speed if applicable.
4. Use Play or Step to run or advance one step.
5. Read the pseudocode and complexity on the right while watching the visualization.
Use New Array to try different inputs and repeat until the behavior and complexity make sense.
## Tech Stack
Built with React, TypeScript, and Tailwind CSS. All logic and animation run in the browser; no backend. Ideal for learning, teaching, and quick reference during interview prep.
---
Try it: [dsavisualizer.jainabhinandan.com](https://dsavisualizer.jainabhinandan.com)
More projects: [jainabhinandan.com](https://jainabhinandan.com) | [Contact](https://jainabhinandan.com/contact)